Detained in Danger
Early on in my tech journey in 2020, I worked on this project with Human Rights First and Harvard College Analytics Group to uncover how COVID-19 was spreading in ICE detention centers.
We scraped data from official ICE websites to create this D3.js visualization and webpage (now defunct). The visualization updated in real time based on changes to the ICE websites. Overall, the project shone light on the serious spread of the virus within immigration detention centers.
Excerpt from the Human Rights First website:
The Harvard College Data Analytics Group, under the auspices of Human Rights First, today launched Detained In Danger, a database that tracks COVID-19 in ICE detention centers.
The data, which shows a disregard for CDC distancing protocols, haphazard testing, and a continually rising rate of COVID-19 infection, raises troubling questions about how asylum-seekers and other detainees are being treated by ICE during this pandemic.
“It’s shocking to see in detail in how many ways ICE is ignoring CDC guidelines for coronavirus at the detention centers it runs,” said Welton Chang, Chief Technology Officer at Human Rights First. “Without Harvard College Analytics Group’s data, leaders might say they’re trying to ameliorate these conditions. Real-time analysis suggests that this kind of abuse may actually be ICE policy. It’s so pervasive, it may as well be.”
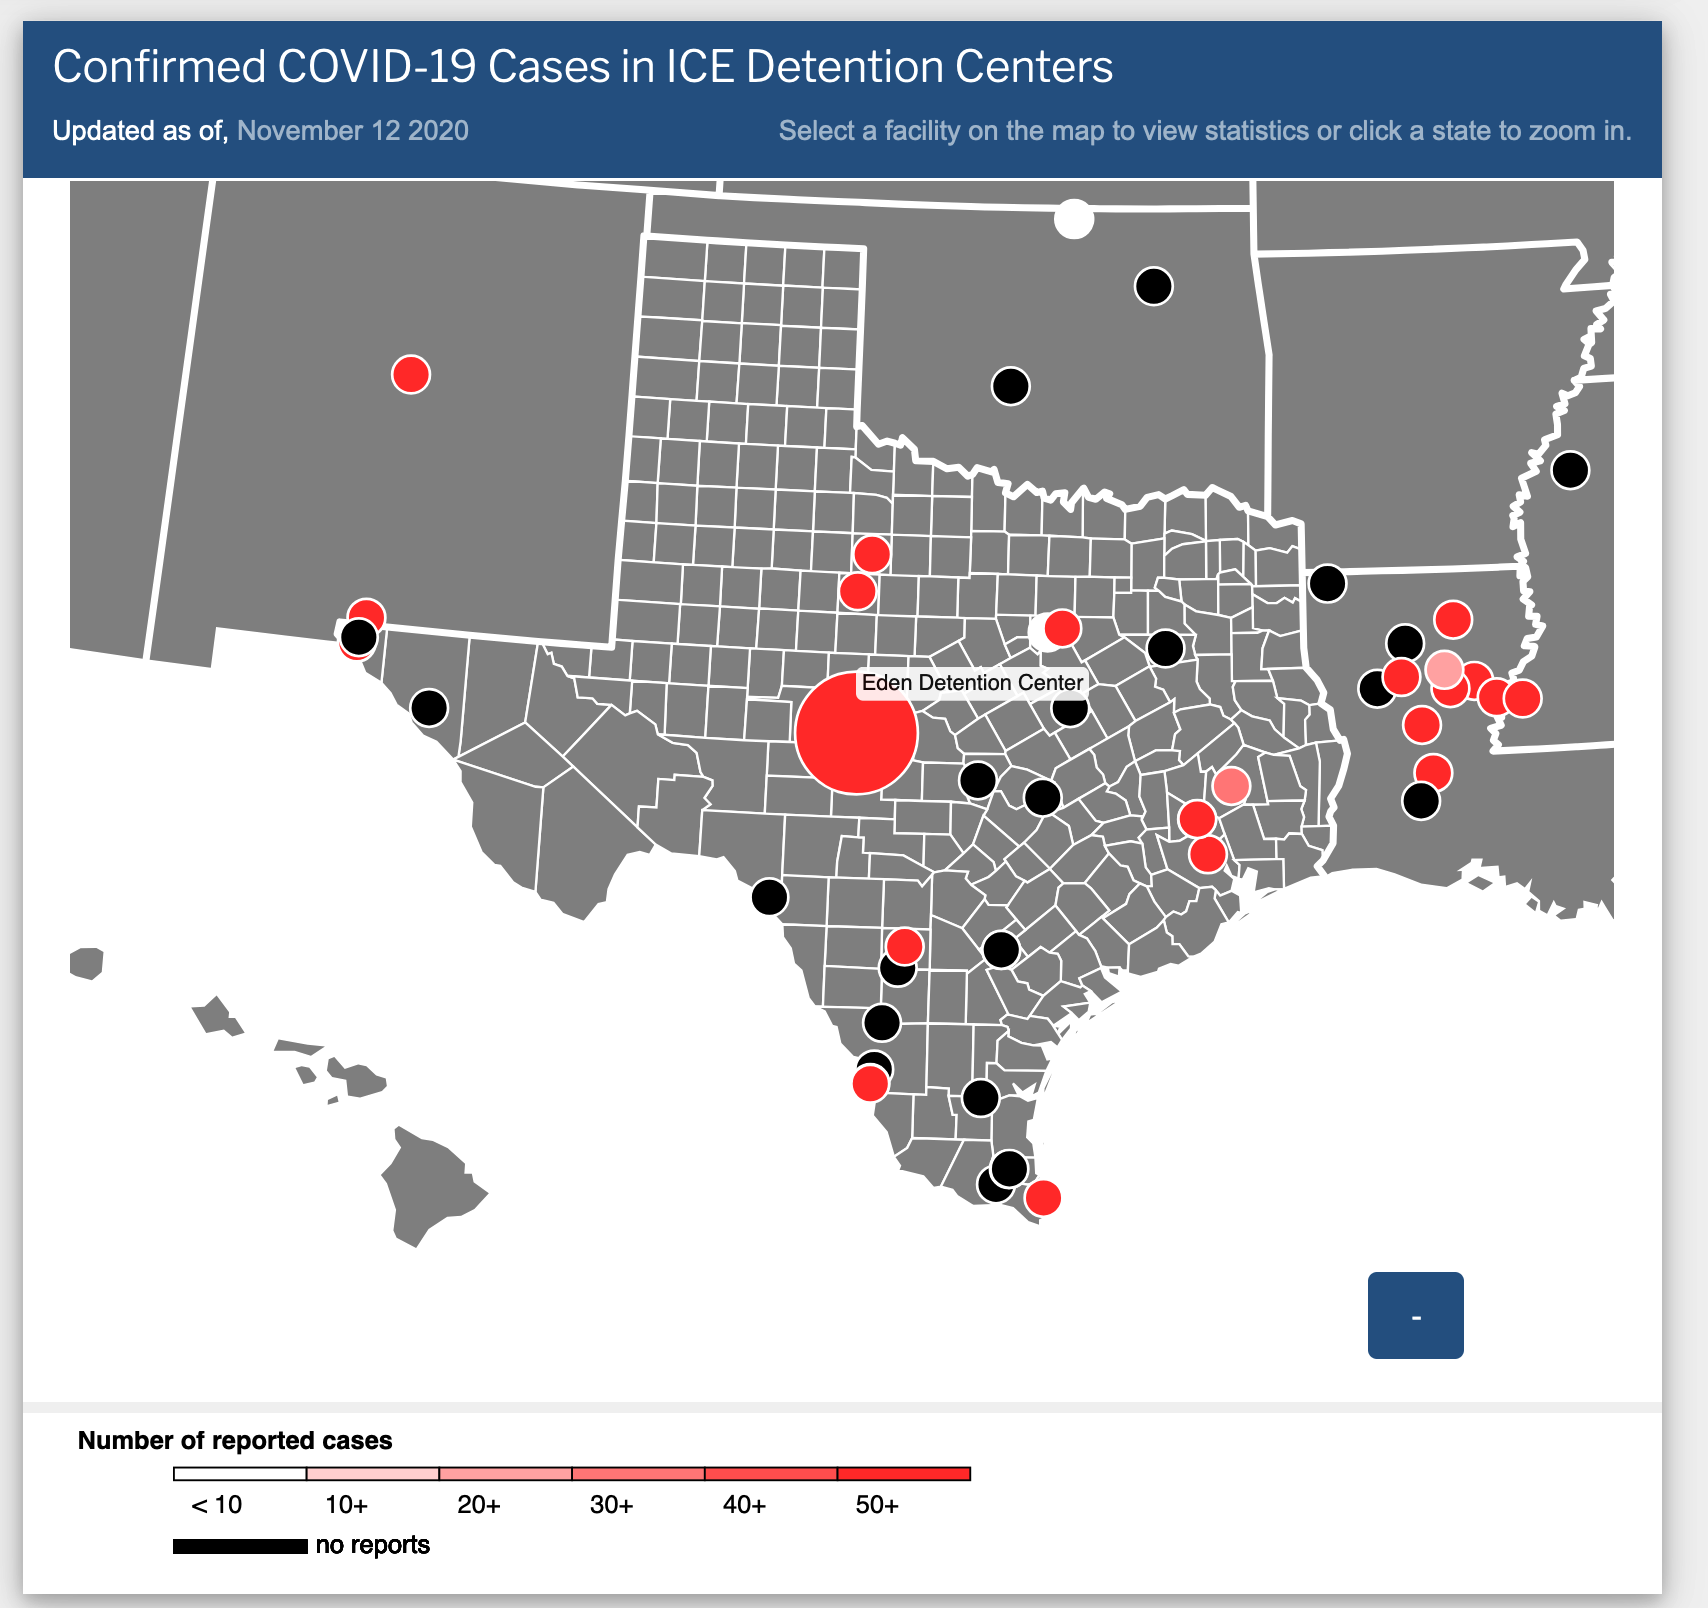
Figure: The above map shows the number of detained people who tested positive for COVID-19 in ICE detention centers across the USA.